
Copper loses 12.8% in a week as nickel and aluminium prices rise
A projected supply gap from 2028 sits beside the November retreat, but the reported data do not identify a single trigger.
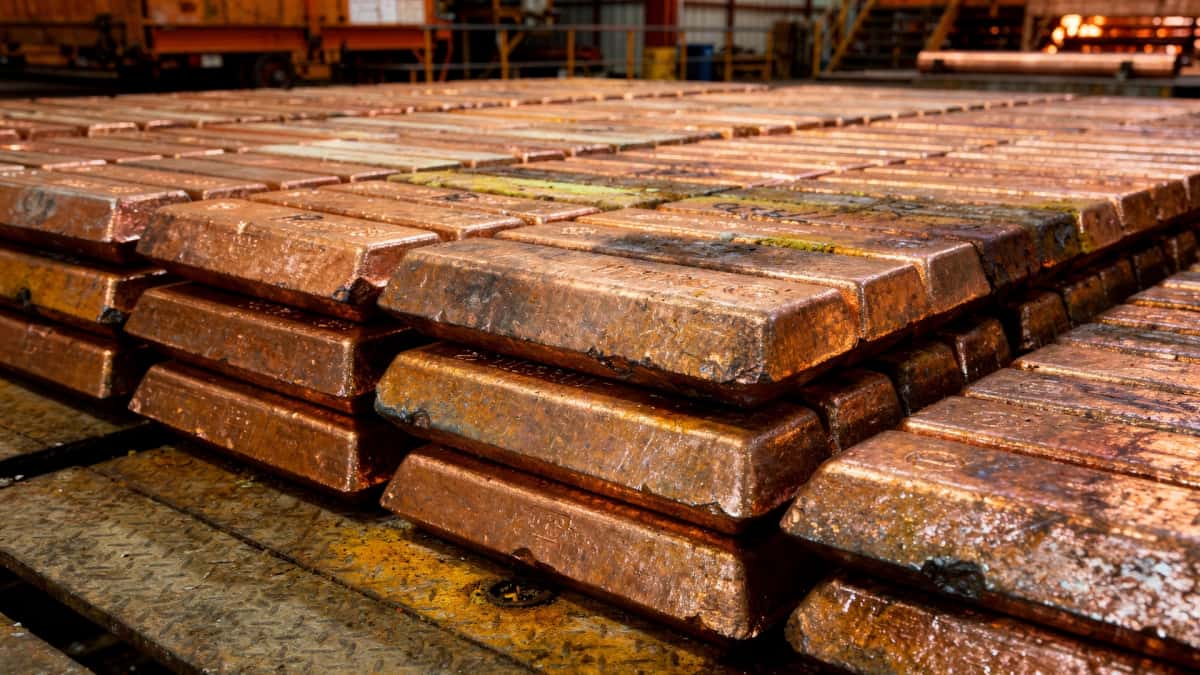
Why it matters: Copper’s price correction shows that long-term demand from power grids and digital infrastructure does not prevent sharp moves in the near-term market.
12.8% — reported copper price decline in the seven days to November 22, 2026
US$5.49/lb — daily price on November 22, down 2.64% that day
US$6.89/lb — 2026 high, leaving the price 20.37% below that level
US$6.66/lb — highest reported monthly average, in September 2026
The reported copper price fell 12.8% in the seven days to November 22, reaching US$5.49 per pound, even as nickel and aluminium prices rose during November. The move came despite demand expectations tied to the energy transition and digital infrastructure, and alongside a longer-term outlook that points to a possible market deficit later this decade.
The price series recorded an average daily transaction price of US$5.87 per pound during the week. Copper fell 2.64% on November 22; the smallest reported daily decline in that period was 0.36% on November 17. The series does not identify a contract, pricing venue or method for calculating the weekly change and average, limiting direct comparisons with other markets or benchmarks.
Copper retreats from its 2026 peak
The latest decline adds to a negative performance for the year. Copper began 2026 at US$5.76 per pound, putting the November 22 price 4.71% below its starting level. From the year’s high of US$6.89 per pound, the decline reached 20.37%.
The pullback contrasts with broader measures in the same series: the five-year average trend is upward, as is the monthly trend over the past 12 months. The highest monthly average was US$6.66 per pound in September, before prices weakened over the latest 30-day period. Those averages describe longer intervals and do not explain the movement on any individual trading day.
Copper and gold reference prices also fell in the second half of November, while nickel and aluminium advanced. The available information does not assign the moves to one cause or quantify the contribution of individual market factors.
Long-term demand does not set the daily price
Copper’s use in electric vehicles, transmission networks, renewable power, data centres and artificial-intelligence infrastructure supports close attention to its demand outlook. But that structural use does not prevent prices from responding to changing expectations for economic activity, financial conditions or metal availability.
Supply-side pressures can include production interruptions at large mines, including operations in Chile and Peru, export policies and limited smelting capacity. The reported information does not identify a specific mine disruption as the cause of the November decline. Currency movements, Chinese manufacturing data and signals on US Federal Reserve interest rates can also influence copper prices.
The London Metal Exchange is a central reference for globally traded copper, but the reported series does not establish that its figures correspond to an LME contract. That distinction matters when comparing the quoted price with benchmark trading.
A possible deficit remains a forecast
A market projection points to the possibility of a significant global copper deficit from 2028, alongside expected growth in demand linked to the energy transition. That is a forecast, not a deficit already recorded or a guarantee of near-term price gains. The available data do not specify how long the current correction may last or how supply could develop against projected demand.
More in Resources

Codelco’s 2027 internships offered site transport, but not relocation support
The programme covered offices and industrial sites, while eligibility and the assigned centre shaped what students needed to arrange themselves.

Tin sales rise 72% as LME stocks shrink, while global data remain incomplete
Production, smelting and sales all moved higher, but the reported figures leave key parts of the market balance unclear.
Chile orders Alcaparrosa closure, but the 2022 collapse is only part of the case
The mine had been suspended since July 2022, but the court's findings reach into the Copiapó River aquifer and Tierra Amarilla.